The Week On-Chain (Week 26, 2020)
Despite a drop in BTC's price and GNI score, long-term sentiment is optimistic, with investors hodling more than ever.


Bitcoin Market Health
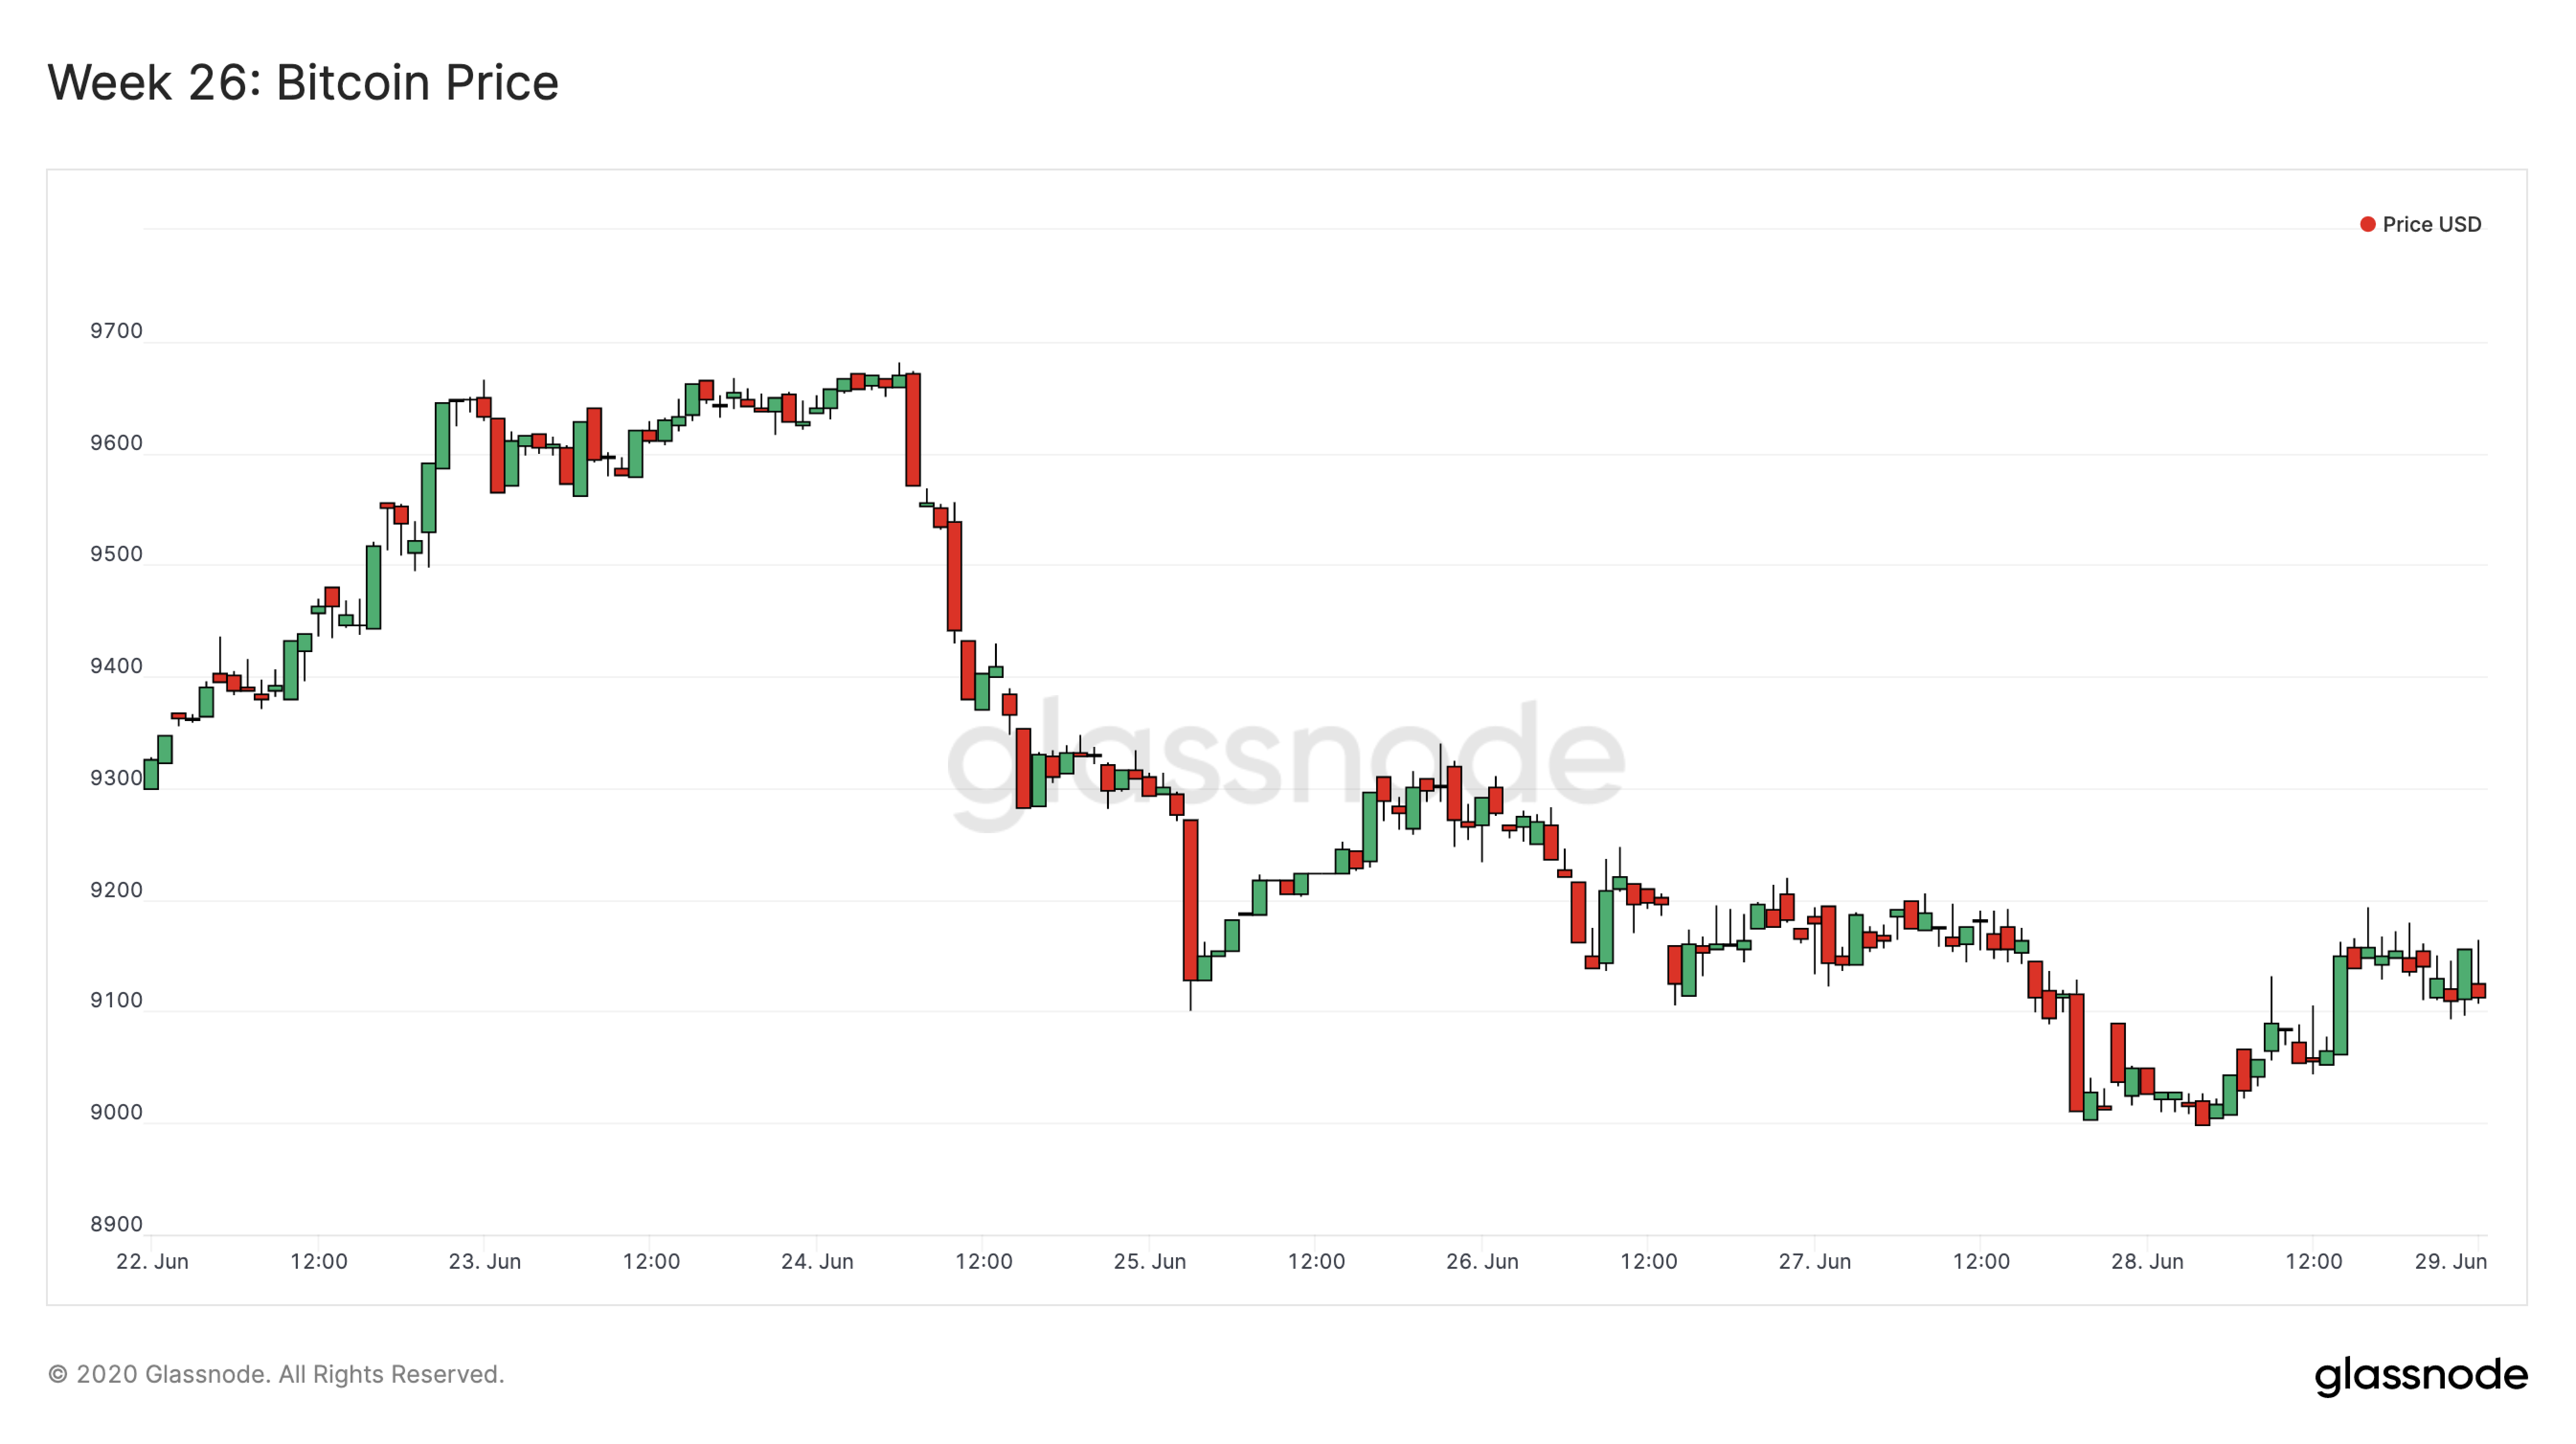
Bitcoin's price took a tumble over the past week after climbing on Monday and Tuesday. The weekend saw it briefly brush below the $9000 mark before settling back up just above $9100.
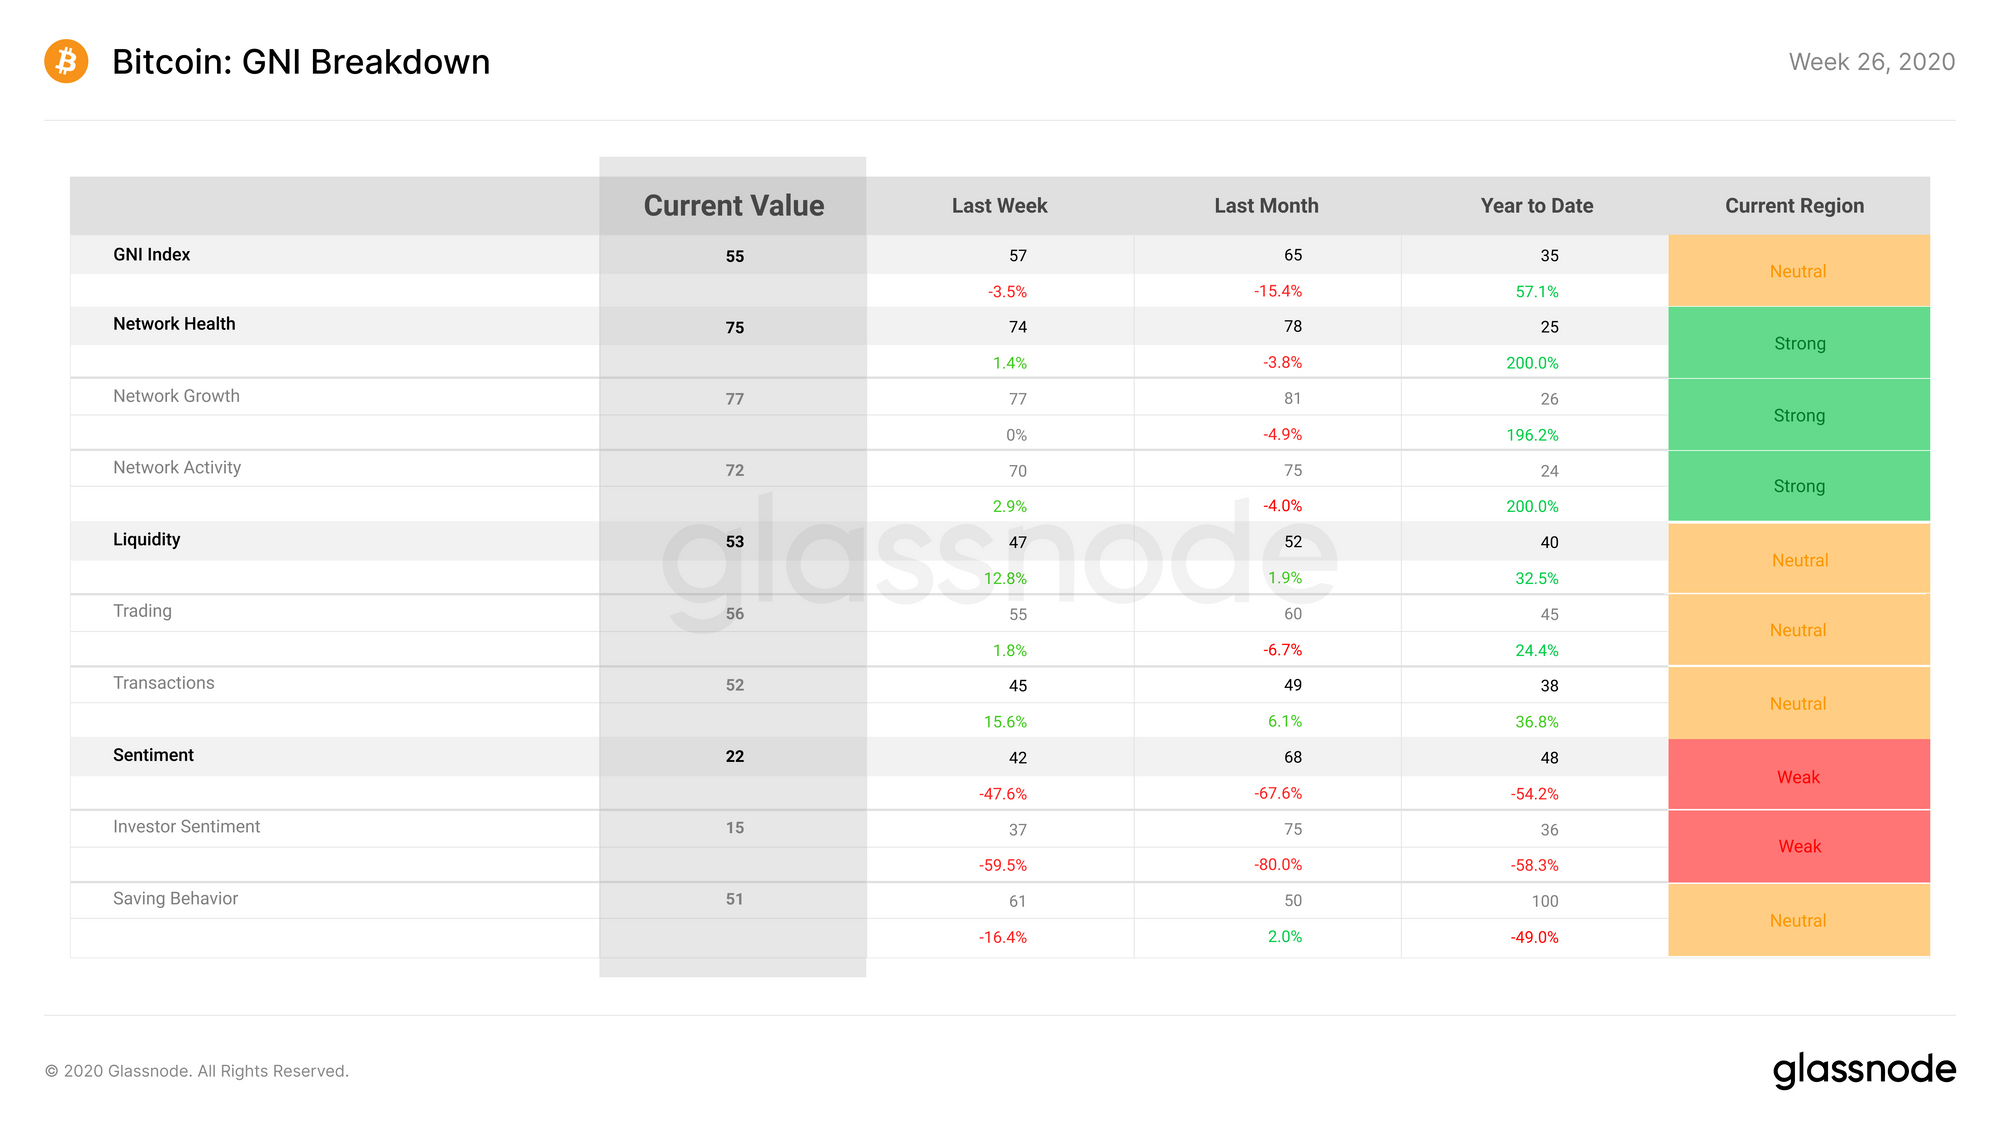
Bitcoin on-chain fundamentals dropped slightly during Week 26. GNI decreased by 2 points, slipping into the "neutral" zone at 55 points, once again due to decreases in the Sentiment subindex.
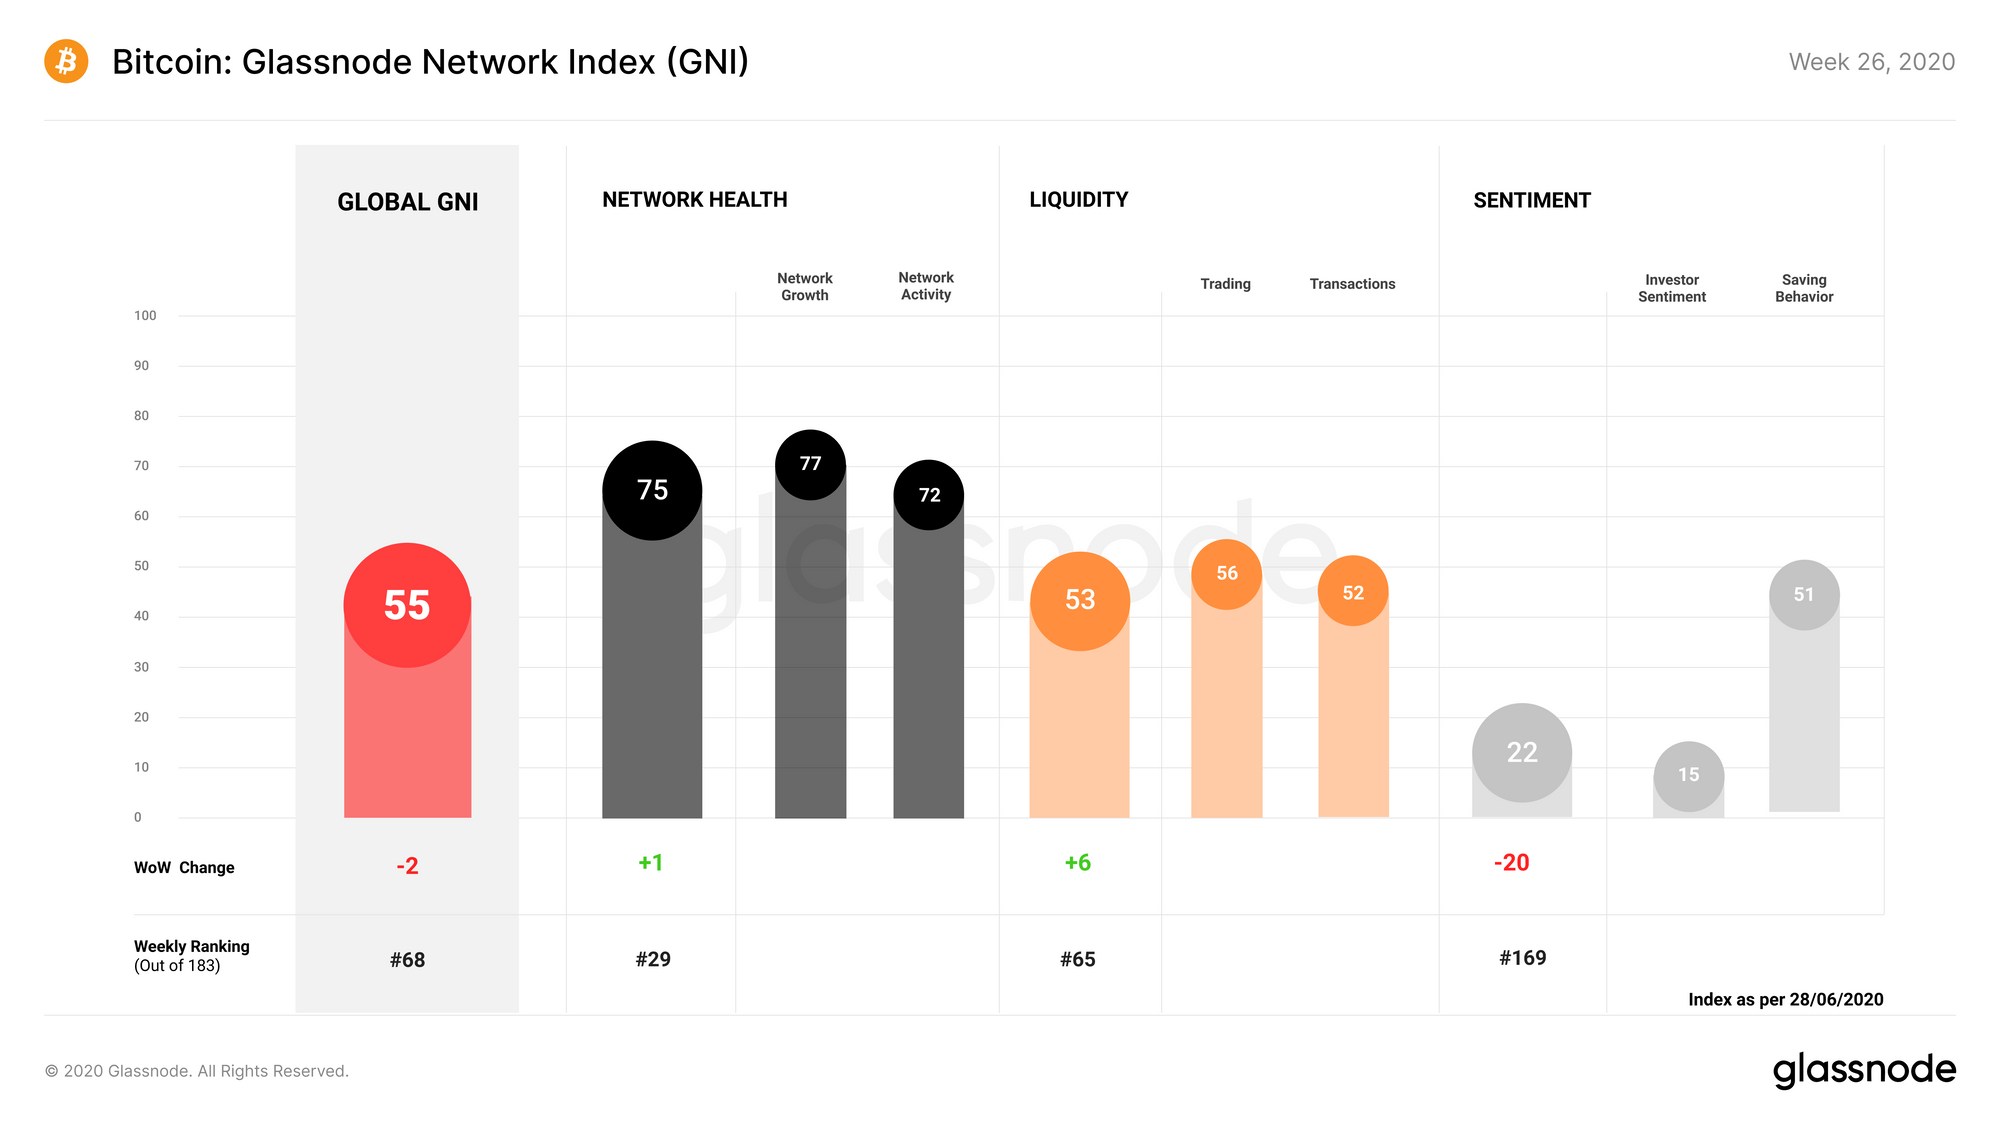
Network Health increased by 1 point last week, with network growth staying static while network activity saw a slight uptick as the number of active entities on-chain increased.
Liquidity saw the week's largest increase of all the subindices, increasing by 6 points to settle back above 50. This was driven by a small increase in off-chain trading liquidity, and a larger increase in transaction liquidity as on-chain transfers increased.
Sentiment once again took a hit over the past week, decreasing by 20 points and reaching a score of just 22 points. This decrease was caused predominantly by a 22 point decrease in the investor sentiment subcategory, which itself decreased due to a drop in MVRV and the supply of BTC in profit. Despite this, however, long-term sentiment remains positive.
Glassnode Compass
The Glassnode Compass outlines the general regime in which Bitcoin is currently located, based on its on-chain fundamentals (as determined by the GNI) and its recent price behavior.
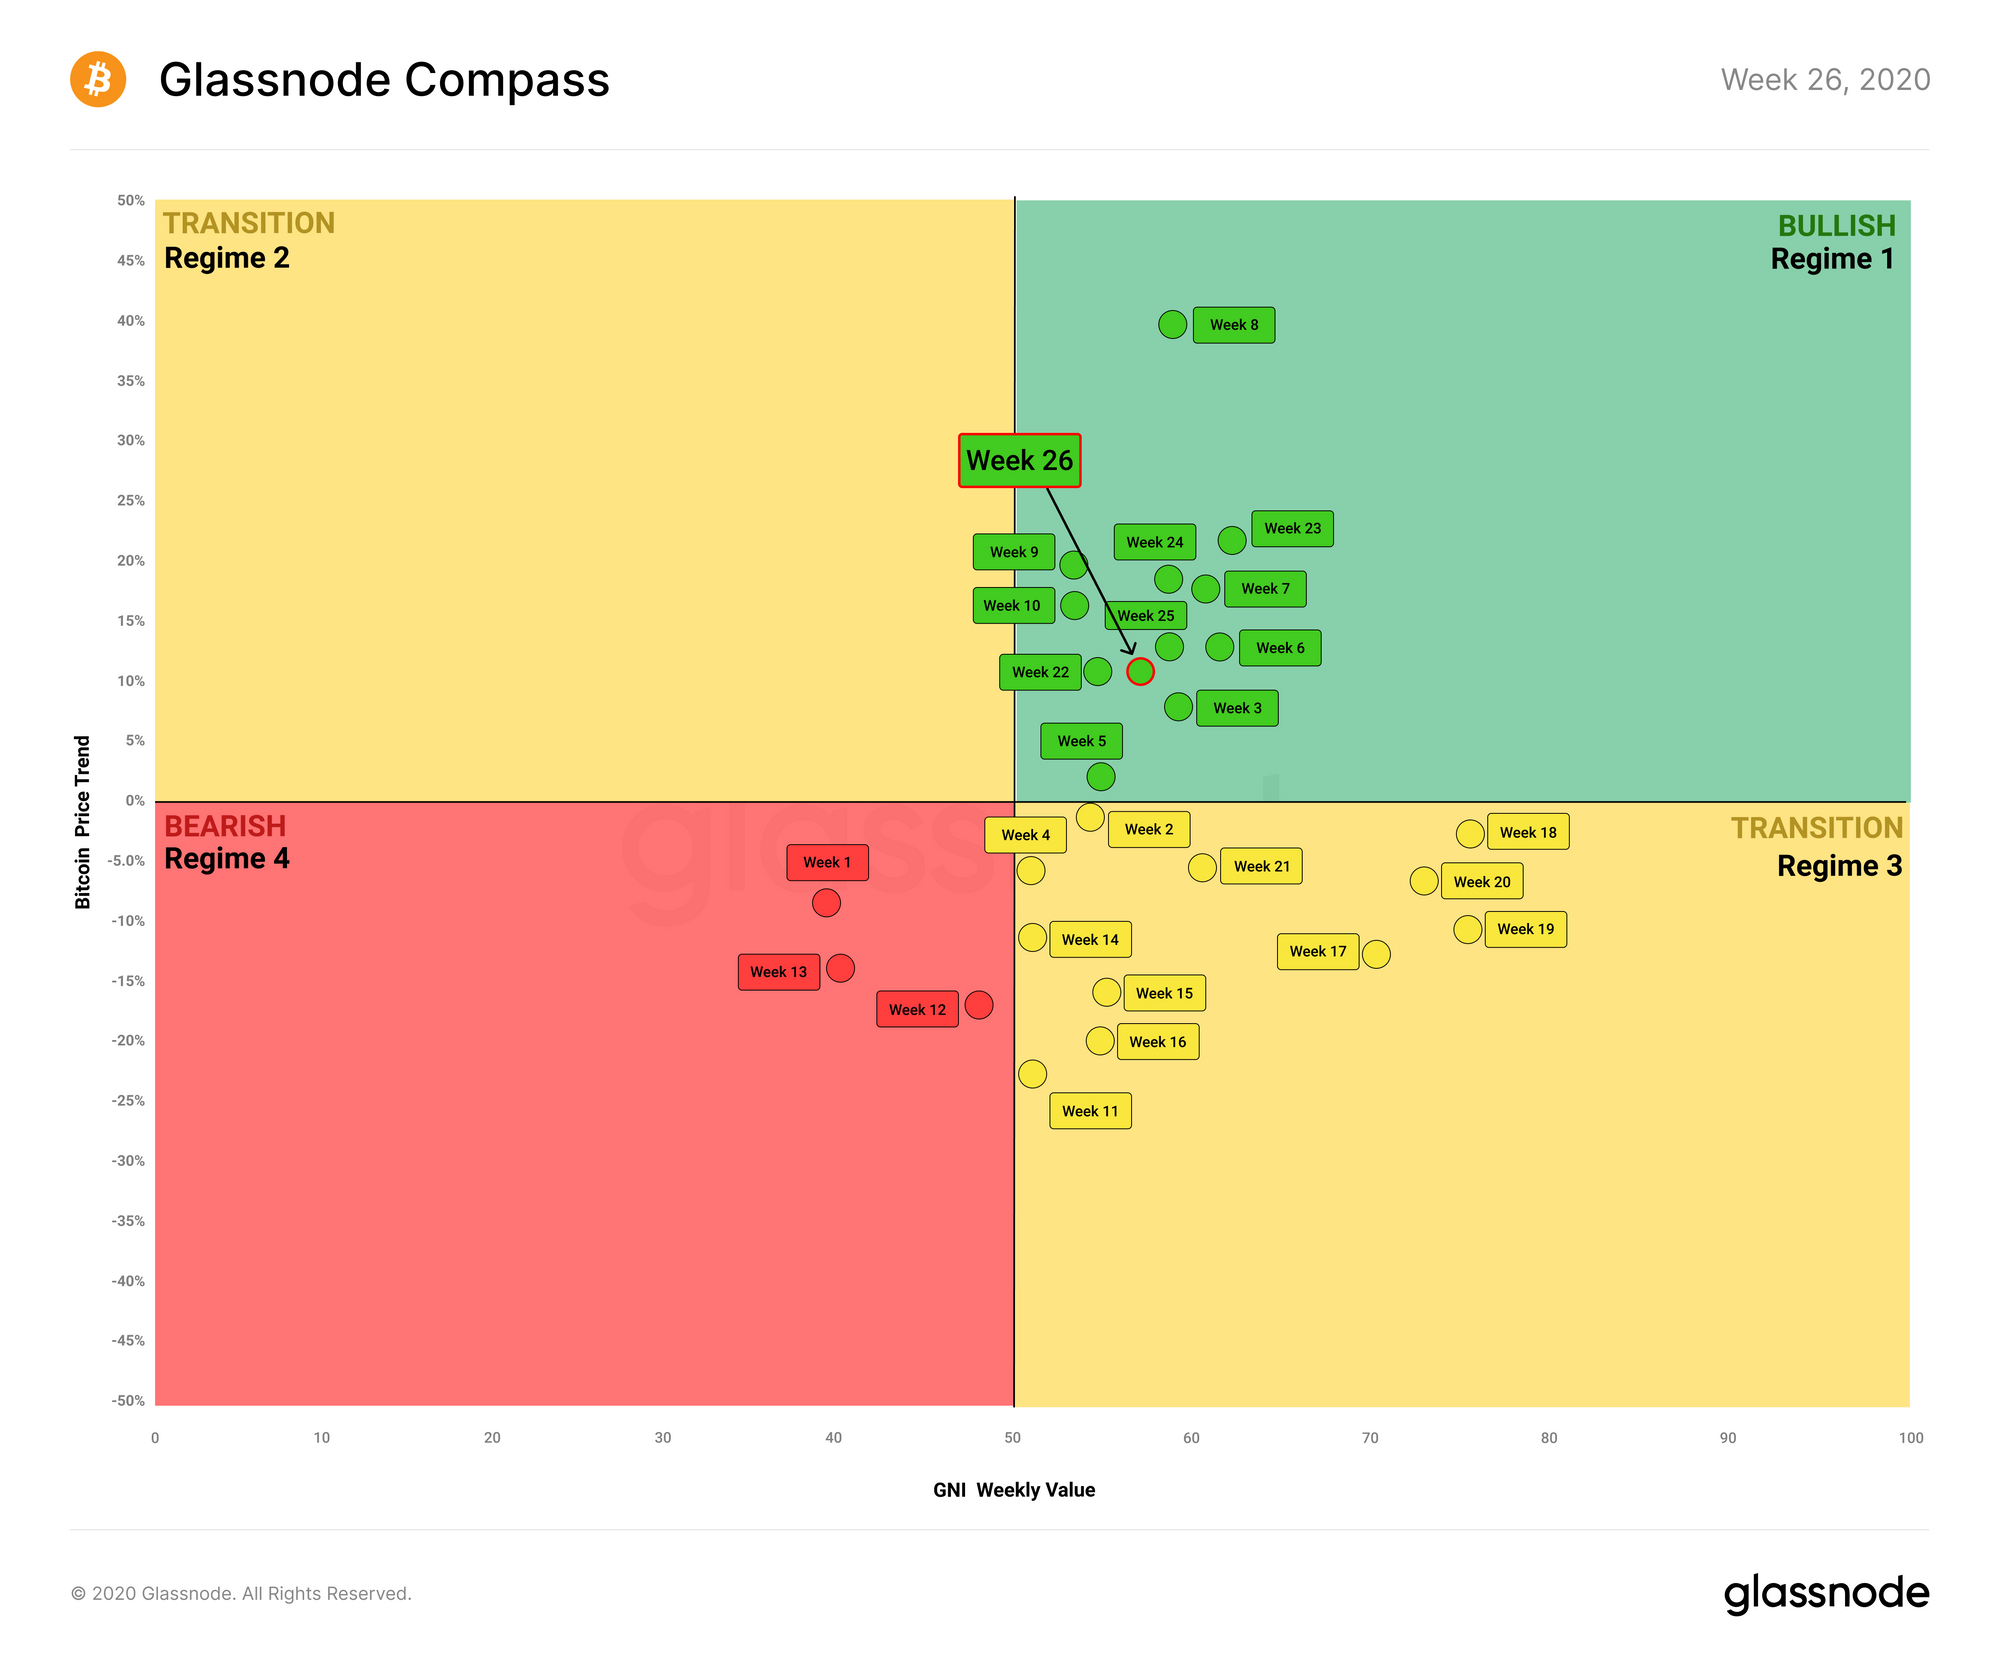
For the fifth week in a row, the compass is in Regime 1, representing a bullish state for the market and for on-chain activity. GNI and bitcoin's price trend both slipped slightly from the previous week, but still remain firmly in the green zone.
This continued stability, both on-chain and off-chain, is a good sign for BTC. Hodling behavior is reaching new highs, suggesting that investors anticipate upwards growth. While this bullish sentiment will not necessarily translate to immediate gains for the price of BTC, the long-term outlook is optimistic.
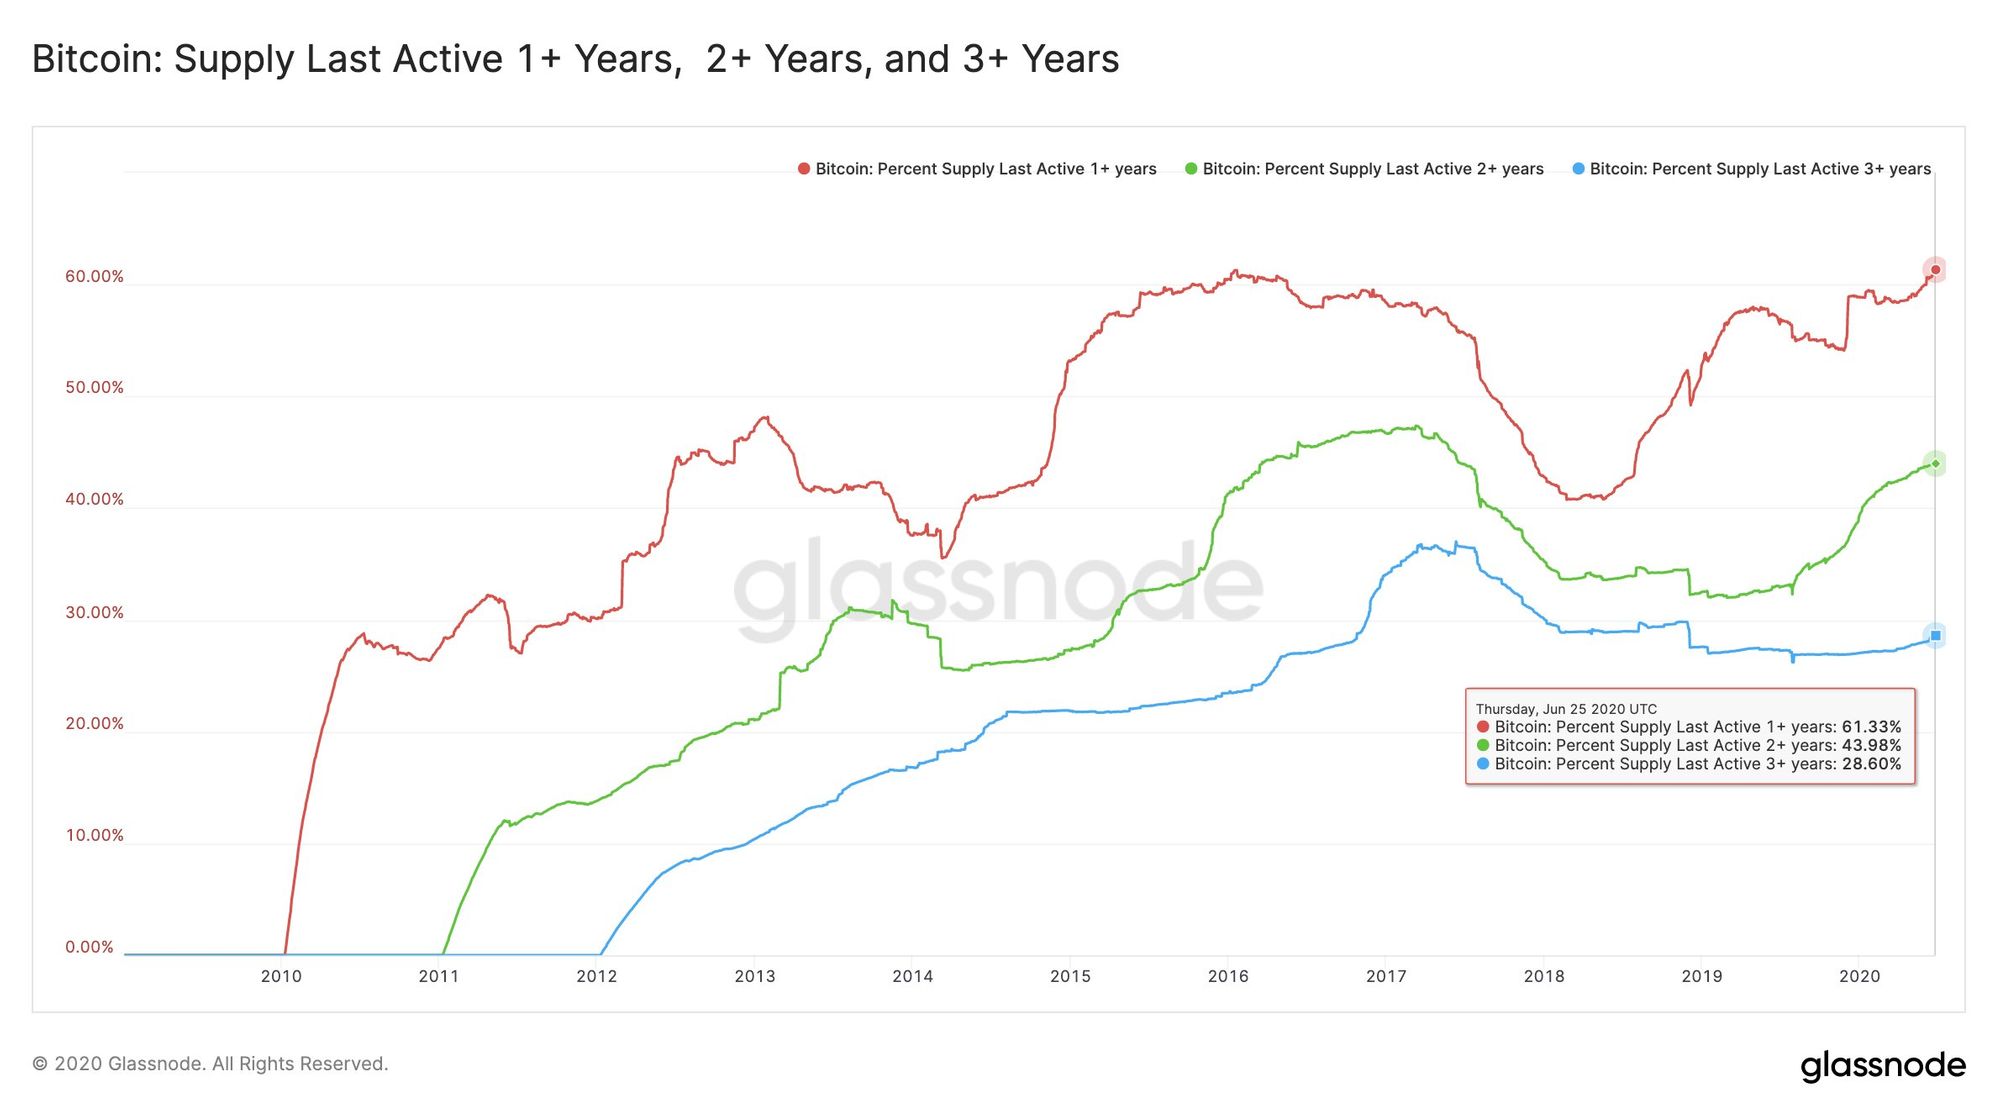
61% of Bitcoin Haven't Moved in Over a Year
We recently released a series of Supply Last Active metrics, which show how long BTC haven't been moved for. These show that over 61% of BTC haven't moved in over a year; a new all-time high for this metric.
Moreover, the number of BTC which haven't moved in 2+ years is at 44%, approaching a new ATH and showing that we are in a period of sustained HODLing.
The last time the number of coins last active 1+ years ago exceeded 60% was in early 2016, just before the price started increasing ever-more-rapidly leading up to the bull run to $20k.
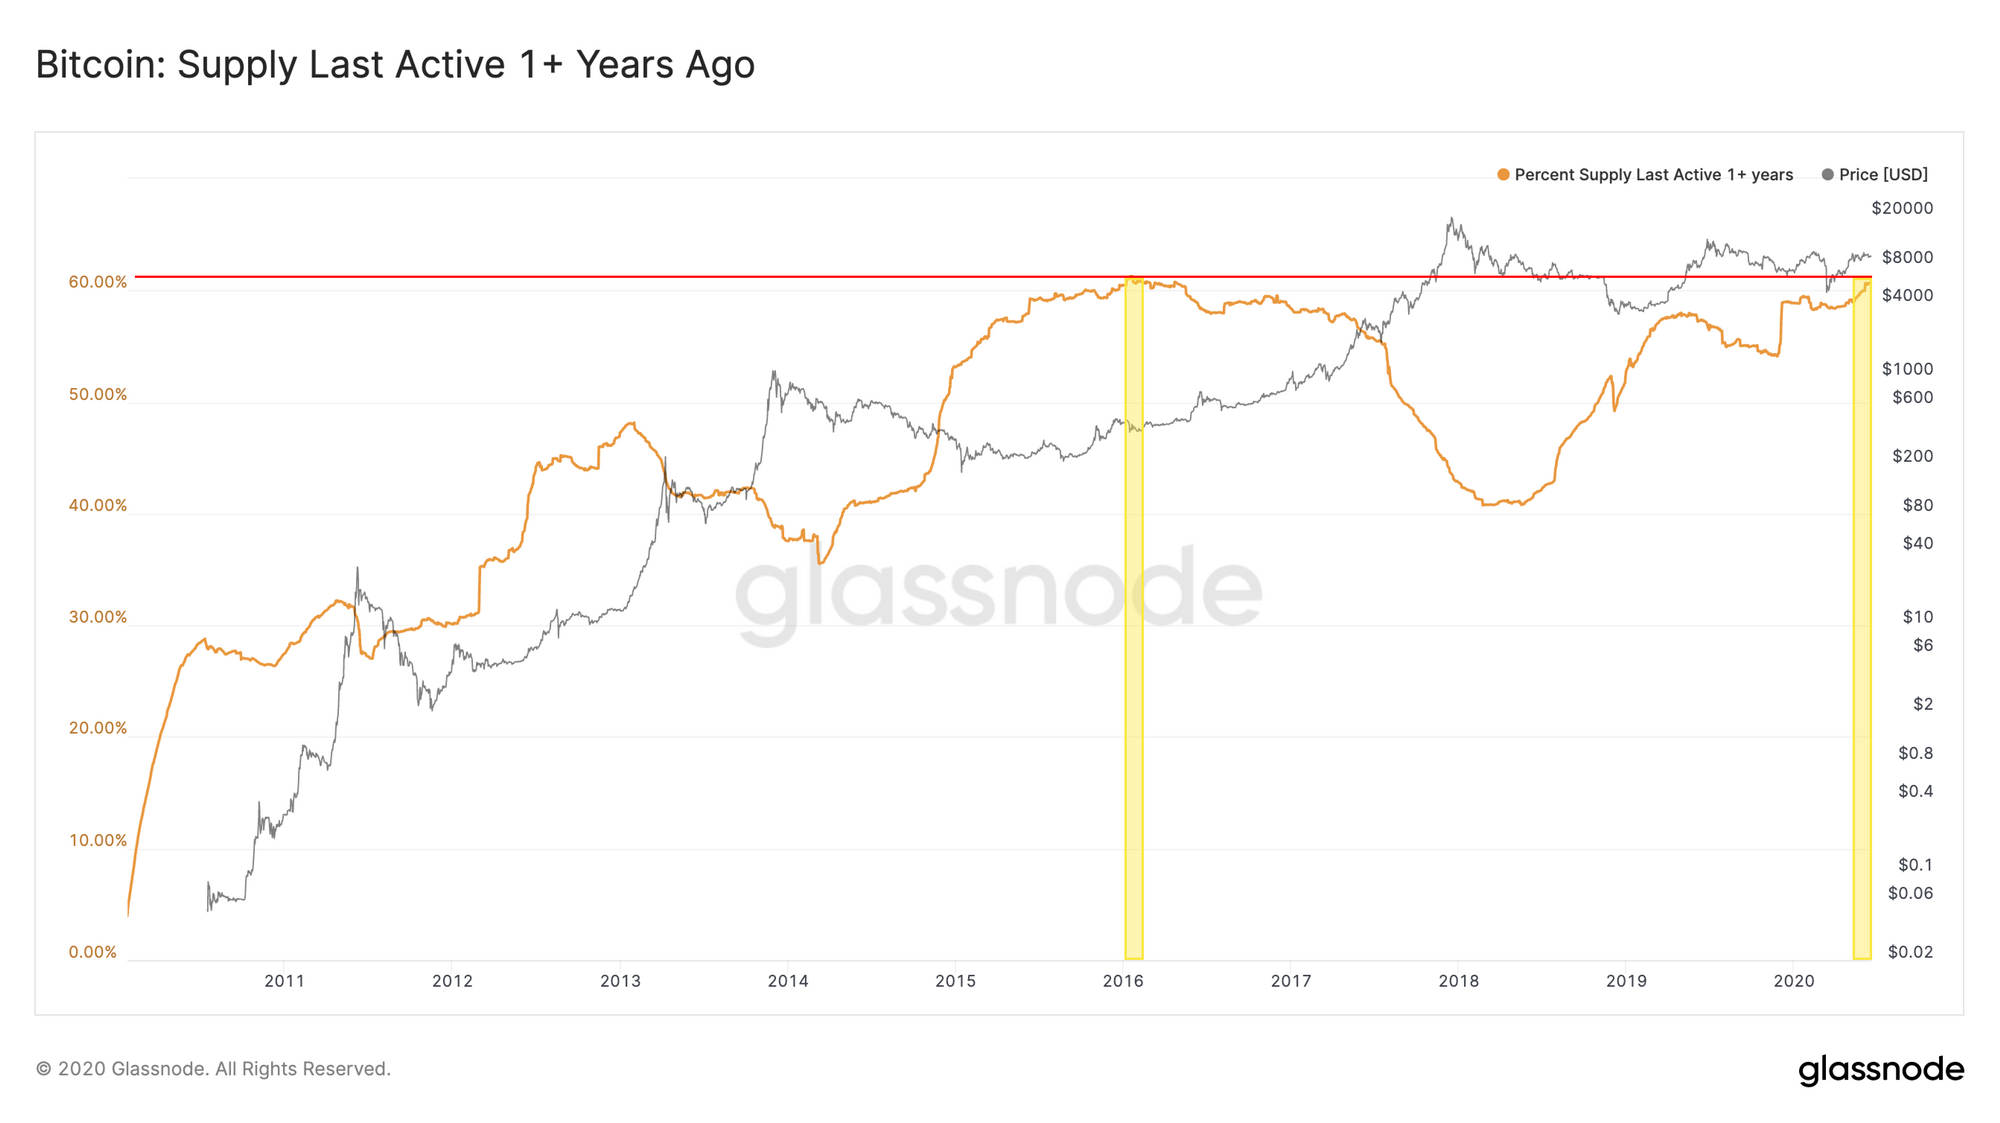
This clear hodling behavior is macro bullish for bitcoin, supporting the narrative that BTC is a store of value. As we have seen in the past, long-term hodling is usually followed by bull markets. It shows that investors overwhelmingly believe that, at current prices, BTC is worth holding rather than selling - suggesting that sentiment favors the price going up.
Product Updates
Metrics and Assets
- Thermocap (BTC, ETH, LTC, BCH) - Metric showing the aggregated USD security spend based on coins paid to miners.
- Addresses with Non-Zero Balance (ERC20) - Updated this metric to include ERC20 tokens, alongside BTC and ETH.
- Exchange Balance (stacked) (BTC, ETH, ERC20) - Added a stacked chart showing coin balance on different exchanges in a single view.
- Exchange metric updates (BTC) - Updated labels to improve accuracy of exchange metrics for Coinbase.
- Added supports for more tokens (ERC20) - COMP, FET, SEELE, DGX, LEO, REP, OKB, NMR, UBT, RDN.
Features

- Follow us and reach out on Twitter
- Join our Telegram channel
- For on–chain metrics and activity graphs, visit Glassnode Studio
- For automated alerts on core on–chain metrics and activity on exchanges, visit our Glassnode Alerts Twitter